"Trailing stop" için komut dosyalarını ara

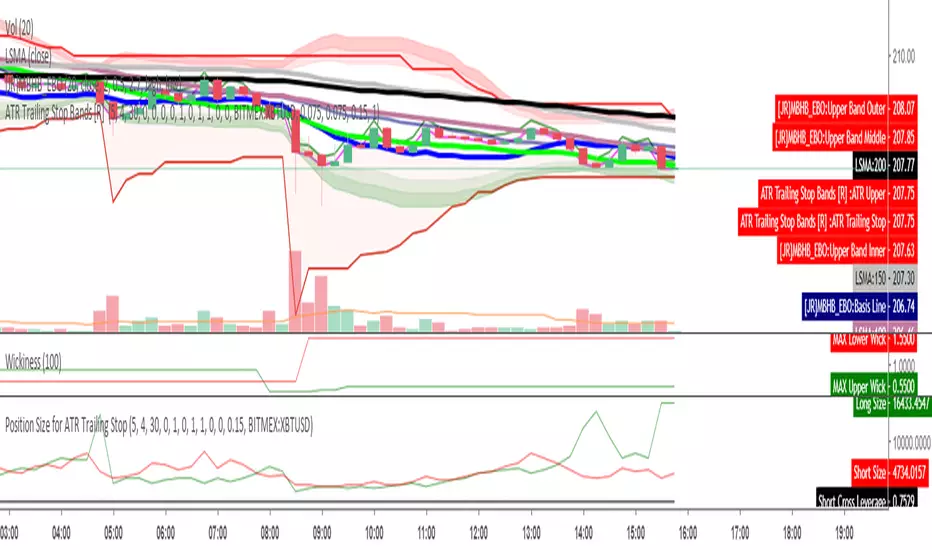
Position Size for ATR Trailing StopThis indicator will calculate your position size, short or long, based on the ATR Trailing Stop indicator of mine, and are needed to be used together. General risk management suggests risking just 1 percent of your equity and using low leverage.
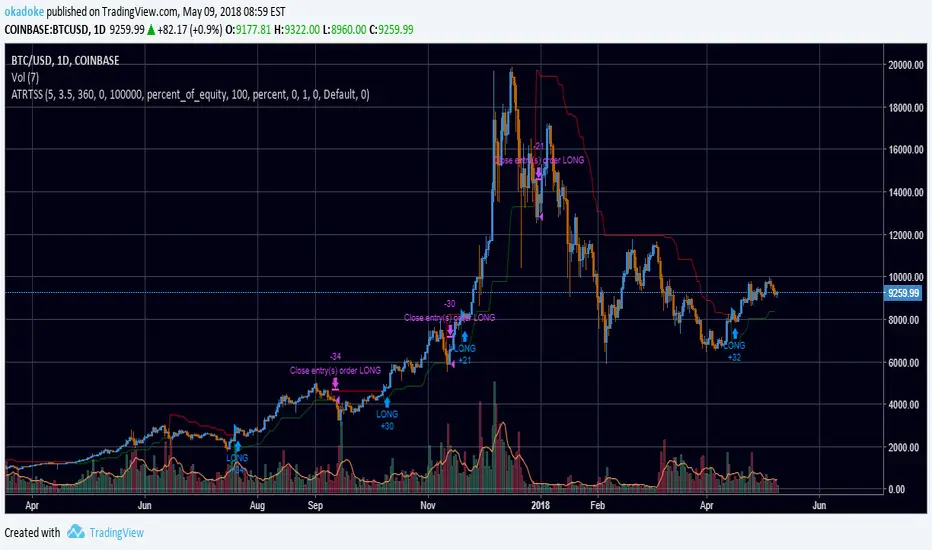
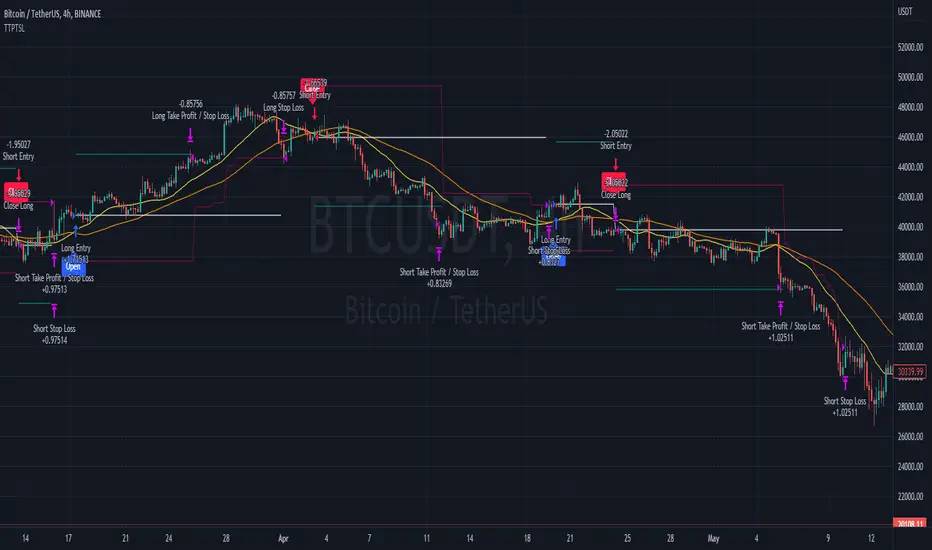
ATR Trailing Stops StrategyUpdate of Average True Range Trailing Stops Strategy by HPotter to include backtesting support
Opens longs when price crosses over trailing stop line, closes when price crosses below
Option to open/close shorts when longs are closed/opened
Option to specify a time range to test over. For example, set Max Days Back to 360 and Min Days Back to 180 to test from 1 year ago to 6 months ago. To test the entire range of data, set both to 0.
%-to-Tick Trailing Stop & VisualizerPercent-to-Tick Trailing Stop (strategy.exit Framework + Visualizer)
Overview
This script focuses on exit management and visualization, not entry performance. The included MA crossover entry is intentionally simple and replaceable.
Core idea (Percent → Tick conversion)
strategy.exit() trailing parameters are tick-based (trail_points, trail_offset, and loss).
This script lets you input distances in percent (%) and converts them into integer ticks using syminfo.mintick, making the same exit logic portable across most tick-based symbols/exchanges with different tick sizes.
//==What it provides==//
1. % → tick conversion for:
- Fixed stop loss (loss)
- Trailing activation distance (trail_points)
- Trailing offset distance (trail_offset)
2. On-chart visualization:
- Entry average price
- Trailing activation threshold
- Fixed stop-loss line
- Trailing stop line (with an exit-bar alignment attempt to reduce gaps)
//==How to use==//
1. Keep the included MA crossover entries, or replace them with your own entries.
2. Configure:
- Fixed Stop Loss % (loss_pct)
- Trailing Activation % (t_points_pct)
- Trailing Offset % (t_offset_pct)
3. Adjust commission/slippage defaults to match your market.
//==Important limitations (must read)==//
- calc_on_every_tick=true recalculates on realtime bars only; historical bars are evaluated differently. Backtests can differ from realtime behavior and may change after reload.
- Tick rounding: percent distances are rounded to integer ticks, so small differences can occur depending on tick size and price level.
- For more realistic intrabar backtesting, consider enabling Bar Magnifier in Strategy Properties (if available).
# Average Entry Price (Basis):
"Calculations are based on the position's average entry price (strategy.position_avg_price)."
# Pine Script v6:
"Written in the latest Pine Script v6."
요약
이 스크립트의 핵심은 “진입 전략”이 아니라 **strategy.exit()의 tick 기반 트레일링 파라미터를 % 입력으로 일반화(%→ticks 변환)**하여, 다양한 심볼/거래소의 서로 다른 tick size 환경에서도 동일한 exit 로직을 재사용할 수 있게 만든 “청산 프레임워크”입니다. 또한 calc_on_every_tick=true 환경에서 트리거/손절/트레일 라인을 실시간에 가깝게 시각화하는 데 중점을 두었습니다.
단, calc_on_every_tick은 실시간 바에서만 틱 단위 재계산이 적용되며, 히스토리 바/백테스트는 평가 방식이 달라 결과가 다를 수 있습니다.

ATR Trailing Stop with Entry Date & First-Day MultiplierATR based trailing stop based on a X post of Aksel Kibar.

EMA Crossover Strategy with Trailing Stop and AlertsPowerful EMA Crossover Strategy with Dynamic Trailing Stop and Real-Time Alerts
This strategy combines the simplicity and effectiveness of EMA crossovers with a dynamic trailing stop-loss mechanism for robust risk management.
**Key Features:**
* **EMA Crossover Signals:** Identifies potential trend changes using customizable short and long period Exponential Moving Averages.
* **Trailing Stop-Loss:** Automatically adjusts the stop-loss level as the price moves favorably, helping to protect profits and limit downside risk. The trailing stop percentage is fully adjustable.
* **Visual Buy/Sell Signals:** Clear buy (green upward label) and sell (red downward label) signals are plotted directly on the price chart.
* **Customizable Inputs:** Easily adjust the lengths of the short and long EMAs, as well as the trailing stop percentage, to optimize the strategy for different assets and timeframes.
* **Real-Time Alerts:** Receive instant alerts for buy and sell signals, ensuring you don't miss potential trading opportunities.
**How to Use:**
1. Add the strategy to your TradingView chart.
2. Customize the "Short EMA Length," "Long EMA Length," and "Trailing Stop Percentage" in the strategy's settings.
3. Enable alerts in TradingView to receive notifications when buy or sell signals are generated.
This strategy is intended to provide automated trading signals based on EMA crossovers with built-in risk management. Remember to backtest thoroughly on your chosen instruments and timeframes before using it for live trading.
#EMA
#Crossover
#TrailingStop
#Strategy
#TradingView
#TechnicalAnalysis
#Alerts
#TradingStrategy

Statistical Trailing Stop [LuxAlgo]The Statistical Trailing Stop tool offers traders a way to lock in profits in trending markets with four statistical levels based on the log-normal distribution of volatility.
The indicator also features a dashboard with statistics of all detected signals.
🔶 USAGE
The tool works out of the box, traders can adjust the data used with two parameters: data & distribution length.
By default, the tool takes volatility measures of groups of 10 candles, and statistical measures of the last 100 of these groups then traders can adjust the base level to use as trailing, the larger the level, the more resistant the tool will be to moves against the trend.
🔹 Base Levels
Traders can choose up to 4 different levels of trailing, all based on the statistical distribution of volatility.
As we can see in the chart above, each higher level is more resistant to market movements, so level 0 is the most reactive and level 3 the least.
It is up to the trader to determine the best level for each underlying, time frame and market conditions.
🔹 Dashboard
The tool provides a dashboard with the statistics of all trades, making it very easy to assess the performance of the parameters used for any given market.
As we can see on the chart, all Daily BTC signals with default parameters but different base levels, level 2 is the best performing of all four, giving a positive expectation of $2435 per trade, taking into account all long and short trades.
Of note are the long trades with a win rate of 76.47% and a risk-to-reward of 3.34, giving a positive expectation of $4839 per trade, with winners having an average duration of 210 days and losers 32 days.
This, compared to short trades with negative expectation, speaks to the uptrend bias of this particular market.
🔶 SETTINGS
Data Length: Select how many bars to use per data point
Distribution Length: Select how many data points the distribution will have
Base Level: Choose between 4 different trailing levels
🔹 Dashboard
Show Statistics: Enable/disable dashboard
Position: Select dashboard position
Size: Select dashboard size

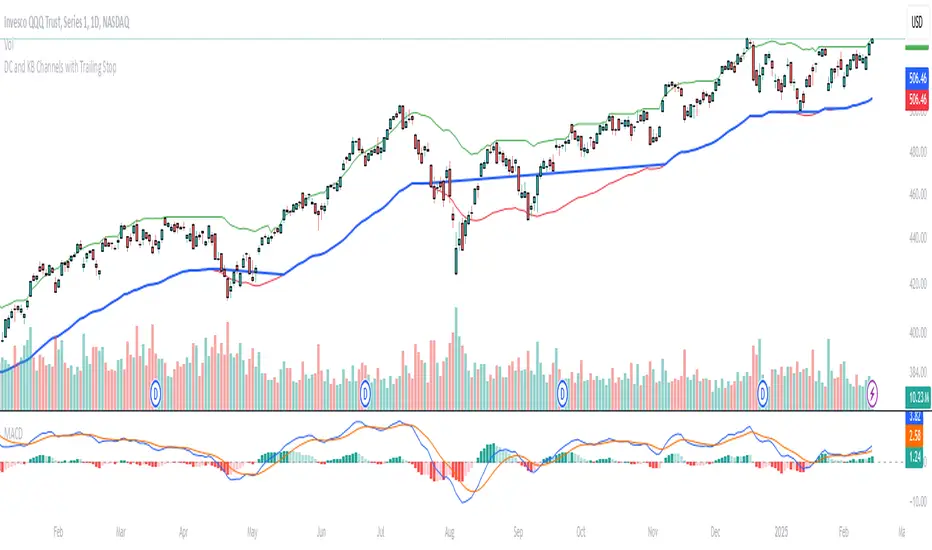
Donchian and Keltner Channels Trend Following with Trailing StopLong Only Trend-following model based on Keltner Channels and Donchian Channels.
These indicators include a noise region, which allows prices to oscillate without requiring position adjustments.
When price trades above the upper band, it signals strength; when it trades below the lower band, it signals weakness.
Keltner Channels
Keltner Channels are volatility-based envelopes set above and below an exponential moving average. Keltner Channels use the Average True Range (ATR), which measures daily volatility, to set channel distance.
Donchian Channel
Donchian Channels are are used to identify market trends and volatility. The upper and lower bands are based on the highest high and lowest low of a specified period. When the price moves above the upper band, it indicates a bullish breakout, while a
move below the lower band indicates a bearish breakout. The distance between the upper and lower channel of the Donchian Channel indicates the asset’s volatility.
Trend Following Model
The default settings are:
Upper Keltner and Upper Donchian Channel Length : 20
Lower Keltner and Lower Donchian Channel Length : 40
Keltner ATR Multiplier: 2
Entries, Exits and Trailing Stop
Entry : When price exceeds the upper band of at least one of these indicators.
Exit : When price undercuts the lower band of at least one of these indicators.
Trailing Stop : See below.
Trailing Stop
This is a stop-loss order that moves with the price of the underlying. It is designed to “trail” the price up (in the case of a long position) or down (for a short position), locking in profits as the price moves in a favorable direction.
At the end of day t, there was a Trailing Stop level in place. For the next day (day t + 1), the Trailing Stop will be adjusted. The new Trailing Stop will be the higher of two values:
The Trailing Stop from the previous day (day t).
The Lower Band computed at the end of day t + 1.
ATR+StdTR Band and Trailing StopThis Pine Script code plots the "ATR+StdTR Band and Trailing Stop," serving as a tool for volatility-based risk management and trend detection. While bands are typically set using a multiple of ATR, this script uses StdTR (the True Range standard deviation) and sets the band width based on ±(ATR + n times StdTR). StdTR is a great tool for detecting price volatility and anomalies, allowing traders to adapt to rapid changes in extreme market conditions. This helps traders proactively manage risk during sudden market fluctuations.
The following features are provided:
Table Display
A table is shown on the chart, allowing traders to visually track the current ATR value, StdTR (σ), and the long/short stop-loss levels (±ATR ± nσ). This enables real-time monitoring of risk management data.
Band Plots
The script plots bands that combine ATR with StdTR (nσ).
The upper and lower bands are calculated using the previous candle’s closing price (the source is customizable) and are plotted as ±(ATR + nσ), providing a clear visual of the price range.
ATR ± nσ Trailing Stop
The trailing stop dynamically adjusts the stop-loss levels based on price movements. In an uptrend, the stop-loss rises, while in a downtrend, it lowers, helping traders lock in profits while minimizing losses during significant reversals.
Breakout Detection
Breakouts are detected when the price exceeds the upper band or drops below the lower band. A visual marker (X) is displayed on the chart, allowing traders to quickly recognize when the price has moved beyond normal volatility ranges, making it easier to respond to trend formations or reversals.
Customization Points:
The ATR period and StdTR (n) are fully customizable.
The source for ATR band calculation can be adjusted, allowing traders to choose from close, open, high, low, etc.
The table’s display position and design (text color, size, etc.) can be customized to present the information clearly and effectively.

Improved EMA & CDC Trailing Stop StrategyImproved EMA & CDC Trailing Stop Strategy
Objective: This strategy seeks to exploit potential trend reversals or continuations using Exponential Moving Averages (EMAs) and a trailing stop based on the Chande Dynamic Convergence Divergence (CDC) ATR method.
Components:
Exponential Moving Averages (EMAs):
60-period EMA (Blue Line): Faster-moving average that reacts more quickly to price changes.
90-period EMA (Red Line): Slower-moving average that provides a smoother indication of long-term price direction.
MACD Indicator:
Utilized to confirm the trend direction. When the MACD line is above its signal line, it may indicate a bullish trend. Conversely, when the MACD line is below its signal line, it may indicate a bearish trend.
CDC Trailing Stop ATR:
Used to set dynamic stop-loss levels that adjust with market volatility. This stop is based on the Average True Range (ATR) with a user-defined multiplier, providing the strategy with a flexible way to protect against adverse price movements.
Profit Targets:
Based on a multiple of the ATR, this sets an objective level at which to take profits, ensuring gains are captured while potentially still leaving room for further profitable movement.
Trading Rules:
Entry:
Long (Buy) Entry Conditions:
Price is above the 60-period EMA.
The 60-period EMA is above the 90-period EMA.
The MACD line is above its signal line.
Price is above the calculated CDC Trailing Stop ATR level.
Short (Sell) Entry Conditions:
Price is below the 60-period EMA.
The 60-period EMA is below the 90-period EMA.
The MACD line is below its signal line.
Price is below the calculated CDC Trailing Stop ATR level.
Exit:
Long (Buy) Exit Conditions:
Price reaches the predetermined profit target based on the ATR.
Price drops below the CDC Trailing Stop ATR level.
Short (Sell) Exit Conditions:
Price reaches the predetermined profit target based on the ATR.
Price rises above the CDC Trailing Stop ATR level.
Visualization:
The strategy displays the 60-period and 90-period EMAs on the chart.
The CDC Trailing Stop ATR levels for both long and short trades are also plotted for clarity.
The MACD Histogram is shown to visualize the difference between the MACD line and its signal line.
Recommendations: Before deploying this strategy, traders should backtest it across various historical data sets and market conditions. Regularly reviewing and potentially adjusting the strategy is recommended as market dynamics evolve.

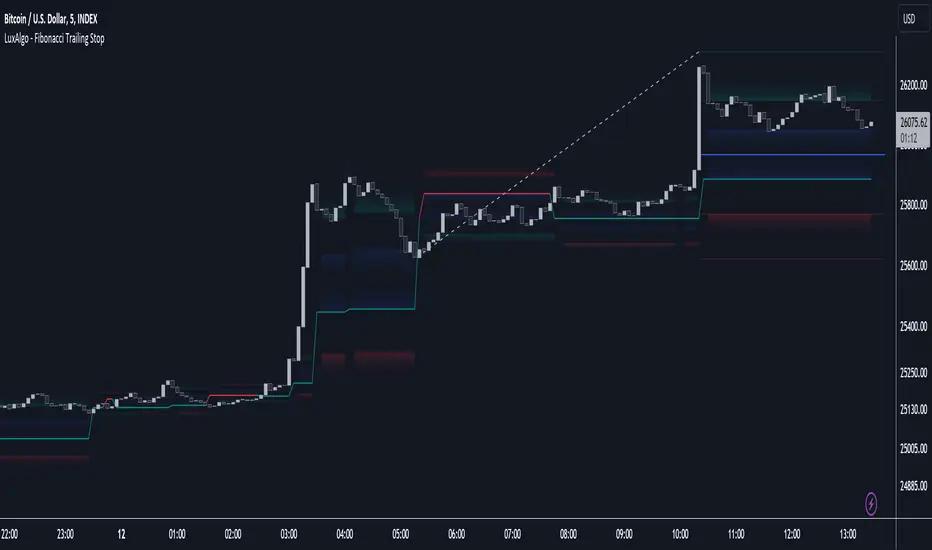
Fibonacci Trailing Stop [LuxAlgo]The Fibonacci Trailing Stop indicator creates a Trailing Stop, based on Fibonacci levels which are retrieved from the latest swing high & low . This provides a Trailing Stop-line .
🔶 USAGE
The Fibonacci Trailing Stop can indicate the current trend direction.
Shadows can also provide potential support/resistance areas.
Users can also display Fibonacci retracements.
🔶 CONCEPTS
🔹 Basic principles
There are 2 basic principles:
Every new swing will create or update a new Fibonacci pattern, potentially changing the Fibonacci Trailing Stop (FTS)
The Trend depends on whether the FTS is crossed/breached, the trigger is a chosen 'level/trigger'
(settings -> Fibonacci Trailing Stop -> Level/Trigger)
In an uptrend, these levels will be placed at the bottom half of the pattern.
In a downtrend, these levels will be placed at the top half of the pattern.
Once a trend is established, the Trailing Stop will only update in the direction of the trend:
Only higher when in an uptrend
Only lower when in a downtrend
If a Trailing Stop line is broken, the trend shifts to the other direction
The FTS line is accompanied by a secondary line (colour-filled), created by smaller swings (half of L/R, rounded to above)
EXAMPLES
• New bullish Trend/pattern
• Updating later on
• Bearish Trend -> breached -> New bullish Trend -> Trend is updated later on, and is breached at the end:
• Trend broken -> new Trend/direction:
• Bearish Trend -> breached -> New bullish Trend -> breached -> New bearish Trend (Here you see the latest cross of the bullish trend)
🔹 Shadows & latest Fibonacci
The indicator contains the option to show:
Latest Fibonacci
Shadows : previous Fibonacci Levels (will only appear after a 1 bar delay)
Shadows can be very useful to provide support/resistance areas, especially from large shadow-blocks .
When shadows are enabled, the color fill of Latest Fibonacci and FTS will be removed, this to provide less clutter:
🔶 SETTINGS
🔹 Swings
L: set left of pivothigh / pivotlow
R: set right of pivothigh / pivotlow
Swing labels: show labels of swings (updated in the same direction)
🔹 Fibonacci Trailing Stop
Level - Toggle - Custom value
• Choose pré-set levels [ -0.5, -0.382, -0.236 , 0, 0.236, 0.382, 0.5, 0.618 ]
• Choose custom level -> Toggle enabled and adjust the number at the right
Trigger: set trigger for breaching the FTS, close or wick (high in downtrend/low in uptrend)
🔹 Fibonacci
Latest Fibonacci: show Latest Fibonacci
Shadows: show Shadows
Volume Delta Trailing Stop [LuxAlgo]The ' Volume Delta Trailing Stop ' indicator uses Lower Time Frame (LTF) volume delta data which can provide potential entries together with a Volume-Delta based Trailing Stop-line .
🔶 USAGE
Our 'Volume Delta Trailing Stop' script can show potential entries/Stop Loss lines
A trigger line needs to be broken before a position is taken, after which a Volume Delta-controlled Trailing Stop-line is created:
🔶 DETAILS
🔹 Volume rises when bought or sold
🔹 When the opening price appears on the chart, a buy/sell order has been executed.
If that order is less than the available supply of that particular price, volume will rise, without moving the price.
🔹 When the opening price is the same as the closing price, the volume of that bar can be seen as "neutral volume" (nV); nor "up", nor "down" volume.
Example
A buy order doesn't fill the first available supply in the order book. This price will be the opening price with a certain volume.
When at closing time, price still hasn't moved (the first available supply in the order book isn't filled, or no movement downwards),
the closing price will be equal to the opening price, but with volume. This can be seen as "neutral volume (nV)".
🔹 Delta Volume (ΔV): this is "up volume" minus "down volume"
🔹 Standard volume is colored red when closing price is lower than opening price ( = "down volume").
🔹 Standard volume is colored green when closing price is higher OR equal (nV) than opening price ( = "up volume").
🔹 Neutral Volume
The "Neutral-Volume" is considered "Up-Volume" - setting will dictate whether nV is considered as green 'buy' volume or not.
🔶 EXAMPLE
29 July 10:00 -> 10:05, chart timeframe 5 minutes, open 29311.28, close 29313.89
close > open, so the volume (39.55) is colored green ("up volume").
(The Volume script used in the following examples is the open-source publication Volume Columns w. Alerts (V) from LucF )
Let's zoom to the 1-minute TF:
The same period is now divided into more bars, volume direction (color) is dependable on the difference between open and close.
Counting up and down volume gives a more detailed result, it remains in an upward direction though):
(ΔV = +15.51)
Let's further zoom in to the 1-second TF:
The same period is now divided into even more bars (more possibility for changing direction on each bar)
Here we see several bars that haven't moved in price, but they have volume ("neutral" volume).
(neutral volume is coloured light green here, while up volume is coloured darker green)
When we count all green and red volume bars, the result is quite different:
(ΔV = -0.35)
In total more volume is found when price went downwards, yet price went up in these 5 minutes.
-> This is the heart of our publication, when this divergence occurs, you can see a barcolor changement:
• orange: when price went up, but LTF Volume was mainly in a downward direction.
• blue: when price went down, but LTF Volume was mainly in an upwards direction.
When we split the green "up volume" into "up" and "neutral", the difference is even higher
(here "neutral volume" is colored grey):
(ΔV = -12.76; "up" - "down")
🔶 CONCEPTS
bullishBear = current bar is red but LTF volume is in upward direction -> blue bar
bearishBull = current bar is green but LTF volume is in downward direction -> orange bar
🔹 Potential positioning - forming of Trigger-line
When not in position, the script will wait for a divergence between price and volume direction. When found, a Trigger-line will appear:
• at high when a blue bar appears ( bullishBear ).
• at low when an orange bar appears ( bearishBull ).
Next step is when the Trigger-line is broken by close or high/low (settings: Trigger )
Here, the closing price went under the grey Trigger-line -> bearish position:
🔹 Trailing Stop-line
When the Trigger-line is broken, the Trailing Stop-line (TS-line) will start:
• low when bullish position
• high when bearish position
You can choose (settings -> Trigger -> Close or H/L ) whether close price or high/low should break the Trigger-line
When alerts are enabled ("Any alert() function call"), you'll get the following message:
• ' signal up ' when bullish position
• ' signal down' when bearish position
After that, the TS-line will be adjusted when:
• a blue bullishBear bar appears when in bullish position -> lowest of {low , previous blue bar's high or orange bar's low}
• an orange bearishBull bar appears when in bearish position -> highest of {high, previous blue bar's high or orange bar's low}
When alerts are enabled ("Any alert() function call"), and the TS-line is broken, you'll get the following message:
• ' TS-line broken down ' when out bullish position
• ' TS-line broken up ' when out bearish position
🔹 Reference Point
Default the direction of price will be evaluated by comparing closing price with opening price.
When open and close are the same, you'll get "neutral volume".
You can use "previous close" instead (as in built-in volume indicator) to include gaps.
If close equals open , but close is lower than previous close , it will be regarded as " down volume ",
similar, when close is higher than previous close , it will be regarded as " up volume "
Note, the setting applies for the current timeframe AND Lower timeframe:
Based on: " open " (close - open)
Based on: " previous close " (close - previous close)
🔹 Adjustment
When the TS-line changes, this can be adjusted with a percentage of price , or a multiple of " True Range "
Default (Δ line -> Adjustment - 0)
Δ line -> Adjustment 0.03% (of price)
Δ line -> Mult of TR (10)
🔶 SETTINGS
🔹 LTF: choose your Lower TimeFrame: 1S (seconds), 5S, 10S, 15S, 30S, 1 minute)
🔹 Trigger: Choose the trigger for breaking the Trigger-line ; close or H/L (high when bullish position, low when bearish position)
🔹 Δ line ( Trailing Stop-line ): add/subtract an adjustment when the TS-line changes ( default: Adjustment ):
• Adjustment ( default: 0 ): add/subtract an extra % of price
• Mult of TR : add/subtract a multiple of True Range
🔹 Based on: compare closing price against:
• open
• previous close
🔹 "Neutral-Volume" is considered "Up-Volume" : this setting will dictate whether nV is considered as green 'buy' volume or not.
🔶 CONSIDERATIONS
🔹 The lowest LTF (1S) will give you more detail and will get data close to tick data.
However, a maximum of 100,000 intrabars can be used in calculations .
This means on the daily chart you won't see anything since 1 day ~ 86400 seconds. (just over 1 bar)
-> choose a lower chart timeframe, or choose a higher LTF (5S, 10S, ... 1 minute)
🔹 Always choose a LTF lower than the current chart timeframe.
🔹 Pine Script™ code using this request.security_lower_tf() may calculate differently on historical and real-time bars, leading to repainting .

Pure Morning 2.0 - Candlestick Pattern Doji StrategyThe new "Pure Morning 2.0 - Candlestick Pattern Doji Strategy" is a trend-following, intraday cryptocurrency trading system authored by devil_machine.
The system identifies Doji and Morning Doji Star candlestick formations above the EMA60 as entry points for long trades.
For best results we recommend to use on 15-minute, 30-minute, or 1-hour timeframes, and are ideal for high-volatility markets.
The strategy also utilizes a profit target or trailing stop for exits, with stop loss set at the lowest low of the last 100 candles. The strategy's configuration details, such as Doji tolerance, and exit configurations are adjustable.
In this new version 2.0, we've incorporated a new selectable filter. Since the stop loss is set at the lowest low, this filter ensures that this value isn't too far from the entry price, thereby optimizing the Risk-Reward ratio.
In the specific case of ALPINE, a 9% Take-Profit and and Stop-Loss at Lowest Low of the last 100 candles were set, with an activated trailing-stop percentage, Max Loss Filter is not active.
Name : Pure Morning 2.0 - Candlestick Pattern Doji Strategy
Author : @devil_machine
Category : Trend Follower based on candlestick patterns.
Operating mode : Spot or Futures (only long).
Trades duration : Intraday
Timeframe : 15m, 30m, 1H
Market : Crypto
Suggested usage : Short-term trading, when the market is in trend and it is showing high volatility .
Entry : When a Doji or Morning Doji Star formation occurs above the EMA60.
Exit : Profit target or Trailing stop, Stop loss on the lowest low of the last 100 candles.
Configuration :
- Doji Settings (tolerances) for Entry Condition
- Max Loss Filter (Lowest Low filter)
- Exit Long configuration
- Trailing stop
Backtesting :
⁃ Exchange: BINANCE
⁃ Pair: ALPINEUSDT
⁃ Timeframe: 30m
⁃ Fee: 0.075%
⁃ Slippage: 1
- Initial Capital: 10000 USDT
- Position sizing: 10% of Equity
- Start: 2022-02-28 (Out Of Sample from 2022-12-23)
- Bar magnifier: on
Disclaimer : Risk Management is crucial, so adjust stop loss to your comfort level. A tight stop loss can help minimise potential losses. Use at your own risk.
How you or we can improve? Source code is open so share your ideas!
Leave a comment and smash the boost button!
Thanks for your attention, happy to support the TradingView community.

Bollinger Bands - Breakout StrategyThe Bollinger Bands - Breakout Strategy is a trend-following optimized for short-term trading in the crypto market. This strategy employs the Bollinger Bands, a widely recognized technical indicator, as its primary instrument for pinpointing potential trades. It is capable of executing both long and short positions, depending on whether the market is in a spot or futures, and is particularly effective in trending markets.
The strategy boasts a high degree of configurability, allowing users to set the Bollinger Bands period and deviation, trend filter, volatility filter, trade direction filter, rate of change filter, and date filter. Furthermore, it offers options for Take Profit, Stop Loss, and Trailing Stop for both long and short positions, ensuring a comprehensive risk management approach. The inclusion of a maximum intraday loss feature adds another layer of protection, making this strategy a valuable tool for traders seeking a professional and adaptable trading system.
Name : Bollinger Bands - Breakout Strategy
Category : Trend Follower based on Bollinger Bands
Operating mode : Long and Short on Futures or Long on Spot
Trade duration : Intraday
Timeframe : 2H, 3H, 4H, 5H
Market : Crypto
Suggested usage : Trending Markets
Entry : When the price crosses above or below the Bollinger Bands
Exit : Opposite Cross or Profit target, Trailing stop or Stop loss
Configuration :
- Bollinger Bands period and deviation
- Trend Filter
- Volatility Filter
- Trade direction filter
- Rate of Change filter
- Date Filter (for backtesting purposes)
- Take Profit, Stop Loss and Trailing Stop for long and short positions
- Risk Management: Max Intraday Loss
Backtesting :
⁃ Exchange: BINANCE
⁃ Pair: BTCUSDT.P
⁃ Timeframe: 4H
⁃ Fee: 0.025%
⁃ Slippage: 1
- Initial Capital: 10000 USDT
- Position sizing: 10% of Equity
- Start : 2019-09-19 (Out Of Sample from 2022-12-23)
- Bar magnifier: on
Credits :
- LucF of Pine Coders for f_security function to avoid repainting using security.
- QuantNomad for Monthly Table.
Disclaimer : Risk Management is crucial, so adjust stop loss to your comfort level. A tight stop loss can help minimise potential losses. Use at your own risk.
How you or we can improve? Source code is open so share your ideas!
Leave a comment and smash the boost button!
Thanks for your attention, happy to support the TradingView community.

TFO + ATR Strategy with Trailing Stop LossThis strategy is an experiment to learn what happens when The Trend Flex Oscillator (by Dr. John Ehlers) is used in conjunction with a volatility indicator like ATR. It was designed with cryptocurrency trading in mind.
The way I coded this experiment makes it unsuitable for bear market conditions.
When applied to a bull market, this trend-following strategy will open long positions when oversold price action appear to be reversing. It will typically close a position within a few days unless it gets caught in a bear market, in which case it holds on for dear life. I have tried to make back-testing very simple, but you should never trust it. It's merely and interesting tool for adjusting the many parameters that I've made editable in the configuration window. Those values include the ATR and TFO parameters, as well as setting a trailing stop loss. When closing a position, the strategy can optionally be told to ignore the trend analysis and only obey the trailing stop loss value. I've made an attempt to allow the user to define the minimum profit necessary to allow the strategy to close all all positions. In my observations, the 2H candlestick charts seem to produce the best results, although the parameters of the strategy could theoretically be adjusted to suit other time periods.
In summary...
This strategy has a bias for HODL (Holds on to Losses) meaning that it provides NO STOP LOSS protection!
Also note that the default behavior is designed for up to 15 open long orders, and executes one order to close them all at once.
Opening a long position is predicated on The Trend Flex Oscillator (TFO) rising after being oversold, and ATR above a certain volatility threshold.
Closing a long is handled either by TFO showing overbought while above a certain ATR level, or the Trailing Stop Loss. Pick one or both.
If the strategy is allowed to sell before a Trailing Stop Loss is triggered, you can set a "must exceed %". Do not mistake this for a stop loss.
Short positions are not supported in this version. Back-testing should NEVER be considered an accurate representation of actual trading results.
// portions © allanster (date window code)
// portions © Dr. John Ehlers (Trend Flex Oscillator)
This code is provided for educational purposes only. The results of this strategy should not be considered investment advice.
The user of this script acknowledges that it can result in serious financial loss when used as a trading tool

Trailing Take Profit Trailing Stop LossThis script demonstrated a dual trailing take profit and stop loss strategy. Where you take 50% (configurable) of the profit when a price level is reached and then you get the rest when a trailing stop loss is hit.
ATR Trailing Stoploss StrategyI am sharing the strategy version of the indicator used before. It is very simple to use.
These are the settings I use, you can change, test and use as you wish.
Atr Period 5
Highest High Period 10
Multiplier 2.5
It can generate more signals in shorter time frames.
The success rate will be higher in longer time frames.


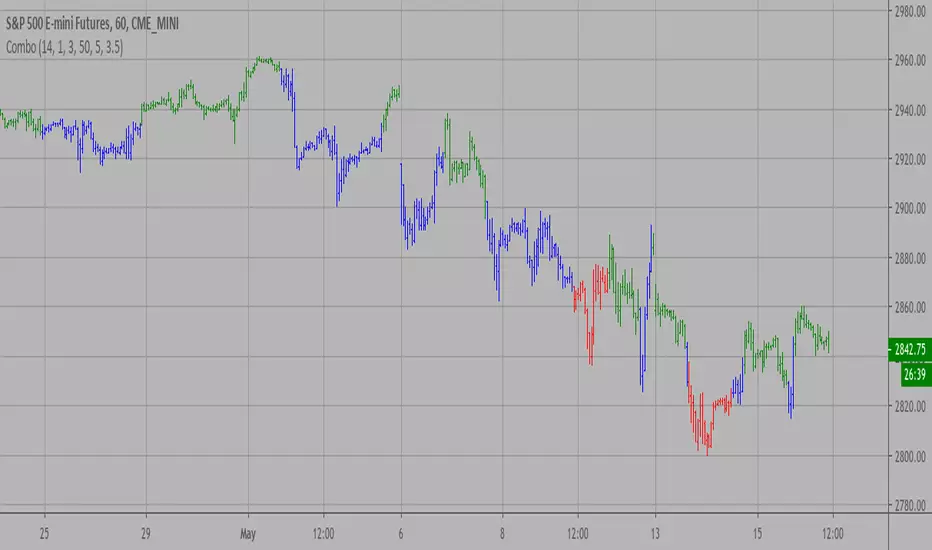
Combo Backtest 123 Reversal & Average True Range Trailing Stops This is combo strategies for get
a cumulative signal. Result signal will return 1 if two strategies
is long, -1 if all strategies is short and 0 if signals of strategies is not equal.
First strategy
This System was created from the Book "How I Tripled My Money In The
Futures Market" by Ulf Jensen, Page 183. This is reverse type of strategies.
The strategy buys at market, if close price is higher than the previous close
during 2 days and the meaning of 9-days Stochastic Slow Oscillator is lower than 50.
The strategy sells at market, if close price is lower than the previous close price
during 2 days and the meaning of 9-days Stochastic Fast Oscillator is higher than 50.
Secon strategy
Average True Range Trailing Stops Strategy, by Sylvain Vervoort
The related article is copyrighted material from Stocks & Commodities Jun 2009
WARNING:
- For purpose educate only
- This script to change bars colors.

Combo Strategy 123 Reversal & Average True Range Trailing Stops This is combo strategies for get
a cumulative signal. Result signal will return 1 if two strategies
is long, -1 if all strategies is short and 0 if signals of strategies is not equal.
First strategy
This System was created from the Book "How I Tripled My Money In The
Futures Market" by Ulf Jensen, Page 183. This is reverse type of strategies.
The strategy buys at market, if close price is higher than the previous close
during 2 days and the meaning of 9-days Stochastic Slow Oscillator is lower than 50.
The strategy sells at market, if close price is lower than the previous close price
during 2 days and the meaning of 9-days Stochastic Fast Oscillator is higher than 50.
Secon strategy
Average True Range Trailing Stops Strategy, by Sylvain Vervoort
The related article is copyrighted material from Stocks & Commodities Jun 2009
WARNING:
- For purpose educate only
- This script to change bars colors.

LongSetups with Entry Signals and Trailing Stop(HA)High probable Long Setups for any time frame and asset.
75+ win rate
Trailing stop always used as exit point
To trade only with the trand - enable MAs in the Inputs tab
x - means Entry signal is active and waiting for long validation
B - on a closed bar is entry signal for long
C - on a developing bar is exit long signal
Green line - long validation line. must close above to go long
Pink line - trailing stop
On Long Entry alert - use Once Per Bar Close option.
On Long Exit alert (Trailing stop triggered) - use Once Per Bar option to trigger sooner and protect your capital.
Always do your own analysis and make trades on your own risk. Find a confluence point where everything aligns and make your own decision. Don't enter a trade because the indicator tells you so. You are free to make a copy of the script and change it to your own needs for your own personal use.
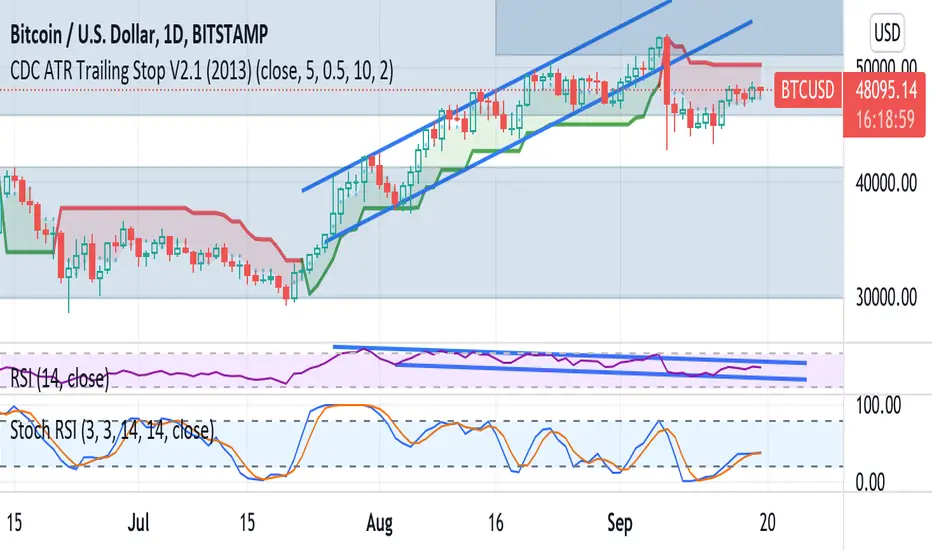
CDC ATR Trailing Stop V2.1 (2013)CDC ATR Trailing Stop V2.1
The indicator / system was developed a few years ago.
Contains two ATR trailing stop lines, fast and slow.
The slow ATR SL line is the same as the one in a normal ATR trailing stop loss indicator.
The fast one is created to generate buy/sell signals
To use the signals, activate them from the indicator's settings (gear icon next to the indicator's name on the chart) and enable buy / sell arrows.
The system works well in high volatility market.
I personally use this as the faster system in conhunction with my slower MA system to diversify portfolio performance.